Major Labour Market Indicators in India
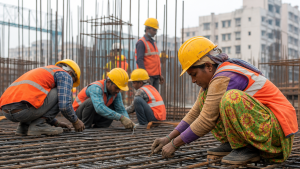
India measures labour market health through key indicators such as LFPR, WPR, and unemployment rate, with PLFS data providing the most regular picture of employment trends across rural and urban areas.
Core Labour Market Indicators and Formulations
India measures its labour market using three fundamental metrics. These parameters evaluate different segments of the population aged 15 years and above.
Labour Force Participation Rate (LFPR)
LFPR is the percentage of persons in the labour force relative to the total population. The labour force consists of individuals who are either employed or actively seeking work (unemployed).
- Formula: LFPR = (Number of Employed Persons + Number of Unemployed Persons) / Total Population × 100
- Interpretation: This metric calculates the proportion of the population that is economically active. It excludes individuals who are not seeking work, such as full-time students, homemakers, and retired individuals.
Worker Population Ratio (WPR)
WPR represents the percentage of employed persons in the total population.
- Formula: WPR = (Number of Employed Persons / Total Population) × 100
- Interpretation: WPR provides a direct measurement of the employment level in the economy. An upward trend points to expanding employment opportunities and higher workforce absorption.
Unemployment Rate (UR)
UR is defined as the percentage of persons unemployed among the total number of people in the labour force.
- Formula: UR = (Number of Unemployed Persons / Labour Force) × 100
- Interpretation: The denominator of the unemployment rate is the labour force (employed + unemployed), not the entire population. This prevents distortion from changes in the number of inactive citizens.
Framework of Measurement: Reference Periods
To capture both long-term structural trends and short-term fluctuations, the NSO uses two distinct reference periods during data collection.
Usual Status (US)
The Usual Status approach measures activity over a long reference period of 365 days preceding the survey date. It classifies individuals based on two sub-categories:
- Principal Activity Status (PS): The activity status on which a person spent the majority of their time (at least 183 days) during the reference year.
- Subsidiary Economic Activity Status (SS): This accounts for individuals who did not work for the majority of the year but performed some economic activity for at least 30 days.
- Usual Status (PS+SS): This combines both principal and subsidiary statuses. It provides a comprehensive picture of chronic or long-term employment.
Current Weekly Status (CWS)
The Current Weekly Status approach uses a short reference period of 7 days preceding the survey date.
- Criteria: A person is classified as employed if they worked for at least 1 hour on any day during the reference week.
- Usage: CWS helps capture seasonal, short-term, and high-frequency variations in employment. It is particularly helpful in urban areas where casual and informal daily wage work is prevalent.
Broad Activity Status of Workers in India
Indian workers are classified into three distinct categories based on their terms of employment and activity status.
Self-Employed
This category accounts for the largest share of employment in India. It is divided into:
- Own-Account Workers and Employers: Individuals who operate enterprise units on their own or with hired labourers.
- Unpaid Family Helpers: Individuals who assist in household enterprises without receiving formal wages.
Regular Wage/Salaried Employees
These individuals work in others’ farm or non-farm enterprises and receive wages or salaries on a regular basis. They are not paid on a daily or casual basis. This segment represents formal or semi-formal employment structures.
Casual Labour
Casual labourers are employed on a day-to-day basis or for specific short-term tasks. They receive daily or weekly wages and have low job security with no social benefits.
Key Findings from the Periodic Labour Force Survey
The latest statistical cycles offer a clear breakdown of India’s labour indicators across rural and urban geographies.
Annual PLFS Report (July 2023 – June 2024)
The annual survey for the 2023-24 period (Usual Status, Age 15+) outlines the following parameters:
| Indicator | Rural (%) | Urban (%) | All-India (%) |
| Labour Force Participation Rate (LFPR) | 63.7 | 52.0 | 60.1 |
| Worker Population Ratio (WPR) | 62.1 | 49.4 | 58.2 |
| Unemployment Rate (UR) | 2.5 | 5.1 | 3.2 |
Calendar Year PLFS Report (January 2024 – December 2024)
The calendar year 2024 dataset under Usual Status (PS+SS) reports the following figures:
| Indicator | Male (%) | Female (%) | Total (%) |
| Labour Force Participation Rate (LFPR) | 79.2 | 40.3 | 59.6 |
| Worker Population Ratio (WPR) | 76.6 | 39.0 | 57.7 |
| Unemployment Rate (UR) | 3.3 | 3.1 | 3.2 |
Gender-Based Dynamics in India’s Labor Market
Gender trends from recent surveys offer important insights into female labor participation.
- Rising Female Participation: Female LFPR has risen from 23.3% in 2017-18 to 41.7% in the 2023-24 fiscal period. This points to a steady entry of women into the labour force.
- Parity in Unemployment: By 2023-24, both male and female unemployment rates reached parity at 3.2% at the national level.
- Divergence in Urban and Rural Female Unemployment: In rural areas, female unemployment is low at 1.2%. In contrast, urban female unemployment remains elevated at 6.7%.
Evolution of Labor Survey Frameworks
The administrative design of labor surveys has evolved to capture real-time economic adjustments.
- Quarterly Bulletins: The government publishes quarterly bulletins focusing solely on urban areas using the Current Weekly Status (CWS) approach.
- Transition to Monthly Surveys: MoSPI updated the PLFS framework to provide monthly estimates for key labor indicators across rural and urban sectors under the CWS model.
- Extended Sample Sizes: The government expanded the household survey coverage to provide reliable estimates of labor indicators with greater precision at the district level.
Recent Context
NITI Aayog’s August 2026 report, Reimagining Skilling for Viksit Bharat@2047, linked labour-market alignment with skilling reforms. It noted 8.7 crore NEET youth, low graduate-job matching, and weak women’s formal employment.
Rare Facts for Prelims
- NEET: The term stands for Not in Education, Employment, or Training.
- PLFS origin: The Periodic Labour Force Survey began in April 2017 to replace the older Employment-Unemployment Surveys.
- Age base: Labour market indicators in India are commonly reported for persons aged 15 years and above.
- Daily work test: Under CWS, even 1 hour of work on any day in the reference week counts as employed.
- Inactive population: Persons such as students, homemakers, and retired individuals are outside the labour force if they are not seeking work.
- Skilling programme: PMKVY is a flagship skill development scheme of the Government of India, and the CAG audit cited in the report covered 56.14 lakh certified candidates.
| Related | |
|---|---|