Important Health Indicators and Their Measurement
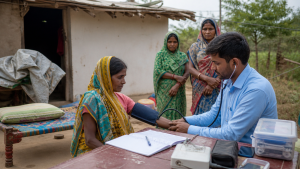
Health indicators are measurable variables used to describe the health of individuals and populations. They help track trends, compare places and periods, assess services and interventions, and identify gaps for policy action. Their meaning depends on how they are defined, measured and interpreted.
Types and Measurement of Health Indicators
Indicators cover mortality, morbidity, disability, nutrition, healthcare access and quality of life. They may measure health outcomes, service availability or people’s use and experience of care. A useful comparison requires a clearly defined population, time period, numerator and denominator; rates and percentages should not be compared without checking these details.
Key Mortality Indicators
Mortality measures describe deaths in a population. Some are expressed per 1,000 population or births, while the maternal mortality ratio is expressed per 100,000 live births.
- Crude Death Rate (CDR): Deaths in a year per 1,000 population. Because it is not adjusted for age, differences in population age structure can affect comparisons.
- Infant Mortality Rate (IMR): Deaths of infants under one year of age per 1,000 live births in a given year.
- Under-5 Mortality Rate (U5MR): Deaths of children under five per 1,000 live births. It is an important indicator of child survival.
- Maternal Mortality Ratio (MMR): Maternal deaths from pregnancy- or childbirth-related causes per 100,000 live births.
- Stillbirth Rate (SBR): Stillbirths per 1,000 total births. Life expectancy at birth estimates the average years a newborn would live if current mortality patterns continued; age-specific mortality rates report deaths in particular age groups.
These indicators capture different aspects of survival and are not interchangeable. For example, CDR uses the total population as its denominator, whereas IMR, U5MR and MMR use live births.
Morbidity, Disability and Nutrition
Morbidity indicators measure the occurrence of disease. Their interpretation depends on whether they count new cases over time or all existing cases at a specified point or period.
- Incidence: New cases arising in a population during a specified period. It helps describe the risk of developing a disease.
- Prevalence: All existing cases in a population at a particular time or over a period. It reflects the overall burden of disease.
- Disability-Adjusted Life Years (DALYs): The sum of years of life lost due to premature mortality and years lived with disability. One DALY represents one lost year of healthy life.
- Quality-Adjusted Life Years (QALYs): A measure combining the quantity and quality of life lived; one QALY is equivalent to one year in perfect health.
- Child nutrition indicators: Stunting is low height-for-age and indicates chronic malnutrition; wasting is low weight-for-height and indicates acute malnutrition; underweight is low weight-for-age and can reflect both acute and chronic malnutrition.
Anemia prevalence is the percentage of a population with anemia, often assessed using haemoglobin levels. DALYs and QALYs are summary measures, but they represent different concepts: health loss and health-adjusted life, respectively.
Healthcare Access and System Indicators
Service indicators help assess healthcare capacity, coverage, use and financial protection. A high level of available resources does not, by itself, show that services are accessible or produce better health outcomes.
- Health expenditure: Public and private health spending as a share of GDP, showing the sector’s spending relative to national economic output.
- Health workforce and infrastructure: Doctor-population and nurse-population ratios, and hospital beds per 1,000 or 10,000 people, measure selected resources available to the population.
- Immunization coverage: The percentage of children receiving recommended vaccinations.
- Antenatal care coverage and institutional delivery: These measure pregnant women’s use of antenatal care and the percentage of births taking place in a healthcare facility. Antenatal coverage may be reported as the proportion receiving at least four visits.
- Water, sanitation and financial protection: Access to improved drinking-water sources and sanitation facilities measures basic service coverage. Out-of-pocket expenditure is the share of health costs paid directly by individuals and indicates financial burden.
In India, “public health and sanitation; hospitals and dispensaries” are subjects under the State List in the Seventh Schedule of the Constitution.
Data Sources and Interpretation
National and international datasets support monitoring, but their estimates depend on definitions, collection methods, coverage and data quality. Survey results may also differ from administrative records or outcome-based measures.
- SDG 3: The Sustainable Development Goal on Good Health and Well-being has 13 targets. Indicators include U5MR, MMR and incidence of HIV, tuberculosis and malaria.
- Global Burden of Disease (GBD) Study: This research effort compares health loss from diseases, injuries and risk factors by age, sex and population, using measures including DALYs. GBD studies are published in The Lancet.
- WHO and Indian sources: WHO compiles statistics, sets standards and publishes reports including World Health Statistics. India’s NFHS provides national, state and district data on health and family welfare; the Sample Registration System (SRS) produces annual estimates of birth rate, death rate and IMR at national and sub-national levels.
Key Prelims Takeaways
- Mortality: CDR, IMR, U5MR, MMR, SBR and life expectancy measure distinct dimensions of survival.
- Morbidity: Incidence counts new cases; prevalence counts existing cases.
- Summary measures: DALYs quantify healthy life lost; QALYs combine life duration and quality.
- Nutrition: Stunting, wasting and underweight use different anthropometric measures and indicate different forms of malnutrition.
- Indian constitutional provision: Public health and sanitation, hospitals and dispensaries are in the State List.
- Data interpretation: Check indicator definitions, denominators, survey methods and population coverage before comparing results.
Recent Context
As of October 2026, Ipsos ranked India third in its Quality of Care Perception Index, behind Malaysia and Singapore. Its 2026 survey reported 68% positive ratings of healthcare quality and 73% ease of obtaining a doctor’s appointment. This perception-based, 32-country comparison is distinct from outcome-based rankings, including the 2018 GBD assessment.
| Related | |
|---|---|