Key Education Indicators for UPSC Prelims
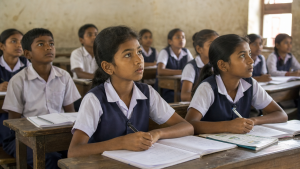
Key education indicators such as GER, NER, LER, literacy rate, and dropout rate help assess access, equity, retention, and learning outcomes in the education system.
Gross Enrolment Ratio (GER)
Definition and Computation
The Gross Enrolment Ratio measures total enrolment in a specific level of education regardless of age. It is expressed as a percentage of the official population belonging to that level.
GER = (Total Enrolment in a Specific Level / Official Population of that Level’s Age Group) × 100
GER can exceed 100% due to early or late school entry, over-age or under-age students, and grade repetition.
Trends Across Education Levels
- Primary Education: Primary GER is near universal in India. NEP 2020 targets 100% GER in school education by 2030.
- Secondary Level: The ratio declines as students move out at various exit points. Secondary GER was recorded at 71.7% in recent UDISE+ data.
- Higher Education: AISHE tracks GER for the 18–23 age group. Higher education GER is about 30% overall, with female GER at 31.2% and male GER at 28.7%. NEP 2020 aims for 50% GER by 2035.
Net Enrolment Ratio (NER)
Definition and Computation
The Net Enrolment Ratio measures enrolment of the official age group for a given level of education. It is expressed as a percentage of the total population of that age group.
NER = (Enrolment of Official Age Group for a Level / Total Population of that Official Age Group) × 100
Unlike GER, NER cannot exceed 100%. It shows age-appropriate grade placement and highlights delayed school entry.
Policy Relevance
NER is a key indicator for tracking SDG 4 on quality education. In India, primary school NER is close to 90%, but it declines in upper primary and secondary stages.
Learning Efficiency Ratio (LER) and Assessment Metrics
Definition and Scope
The Learning Efficiency Ratio measures how effectively the education system converts enrolled schooling years into actual learning outcomes and skill acquisition. It focuses on foundational literacy and numeracy (FLN), not attendance alone.
Key Assessment Frameworks
- National Achievement Survey (NAS): Conducted by PARAKH under NCERT, it assesses competencies in Classes 3, 5, 8, and 10.
- NIPUN Bharat Mission: Aims at universal FLN acquisition by Grade 3.
- Annual Status of Education Report (ASER): Published by Pratham, it tracks basic reading and arithmetic proficiency in rural India.
Literacy Rate
Census and Survey Criteria
In India, literacy rate refers to the percentage of population aged seven years and above who can read and write with understanding in any language.
Key Statistical Data Points
- Overall National Literacy: National sample surveys place India’s literacy rate at 77.7%, up from 74.04% in Census 2011.
- Gender Disparity: Male literacy is 84.7%, while female literacy is 70.3%, creating a gap of 14.4 percentage points.
- Regional Variations: Kerala has the highest literacy rate at over 96%, while Bihar is around 70.9%.
- ULLAS Scheme: Understanding Lifelong Learning for All in Society, formerly the New India Literacy Programme, focuses on adult literacy for non-literate persons aged 15 and above.
Dropout Rate
Definition and Computation
The dropout rate is the percentage of students enrolled in a grade or cycle who leave the school system during an academic year without completing that stage.
Level-Wise Breakdown and Drivers
- Primary Level: The dropout rate has declined to 1.8%–1.9% due to initiatives such as PM POSHAN and Samagra Shiksha Abhiyan.
- Upper Primary Level: The dropout rate is 5.2%.
- Secondary Level: This is the highest drop-off stage, with a dropout rate of 7.0%. Major causes include economic migration, domestic responsibilities, distance to secondary schools, and early entry into the labour force.
Key Educational Facts and Figures
- RTE Reservation: Section 12(1)(c) of the Right to Education Act, 2009 mandates 25% reservation for economically weaker sections in private unaided schools.
- UDISE+: Operates under the Ministry of Education and covers more than 14.67 lakh schools.
- Pupil-Teacher Ratio (PTR): The overall PTR in Indian schools is about 24:1, below the 30:1 benchmark under the RTE Act.
- Girls and Women in Education: Girls constitute 48.4% of total school enrolment, while women make up 54.9% of the teaching workforce.
- PARAKH: Functions as the national assessment centre created under NEP 2020 to standardize board assessments.
Comparative Matrix of Educational Indicators
| Indicator | Primary Focus Area | Data Source Platform | Key NEP 2020 Target |
| Gross Enrolment Ratio (GER) | Capacity and quantitative expansion | UDISE+ / AISHE | 100% in school education by 2030; 50% in higher education by 2035 |
| Net Enrolment Ratio (NER) | Age-appropriate enrolment equity | UDISE+ | Eliminate out-of-school children and ensure grade alignment |
| Learning Efficiency Ratio (LER) | Learning outcome conversion and foundational capabilities | NAS / NIPUN Bharat / ASER | 100% foundational literacy and numeracy by Grade 3 |
| Literacy Rate | Basic reading and writing competency across population groups | Census of India / NSS / ULLAS | 100% youth and adult literacy |
| Dropout Rate | School retention and efficiency of student progression | UDISE+ | Retain all children in school and minimize drop-off points |
Rare Facts for Prelims
- GER and age mismatch: GER can rise above 100% even when actual school attendance is much lower.
- NER ceiling: NER is the only one among these indicators that cannot cross 100%.
- AISHE scope: AISHE mainly captures higher education statistics, especially for the 18–23 age group.
- NAS administration: NAS is not conducted directly by schools; it is administered through PARAKH under NCERT.
- Literacy definition in India: The census definition includes persons aged 7 and above, not 15 and above.
- Secondary dropout concern: Secondary school is often the critical stage where economic and social pressures combine to push students out.
| Related | |
|---|---|