Q. The pie chart drawn belown shows the expenses of a family on various items and its savings during the year 2001. Study the graph and answer the question.
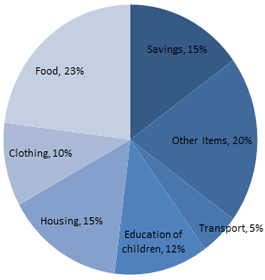
What per cent of income was spent on transport and other items together?
Answer:
25%
Notes: % Expenditure on transport and other items = (20 + 5) % = 25%.