Q. The pie chart drawn belown shows the expenses of a family on various items and its savings during the year 2001. Study the graph and answer the question.
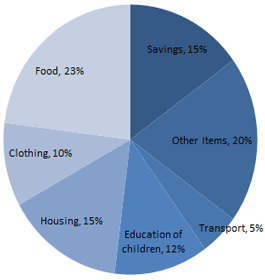
Maximum expenditure of the family was on :

Answer: food
Notes: Maximum expenditure of the family is on food, which is 23%

Question Source: 📚This question is part of Daily Current Affairs 20 MCQs Series in GKToday Android Application. This series can be subscribed in the app only for Rs. 999/- for entire year. Download the app here.
📌 Question Number: 137 in Current Affairs - 2019-20 in the above course in App.